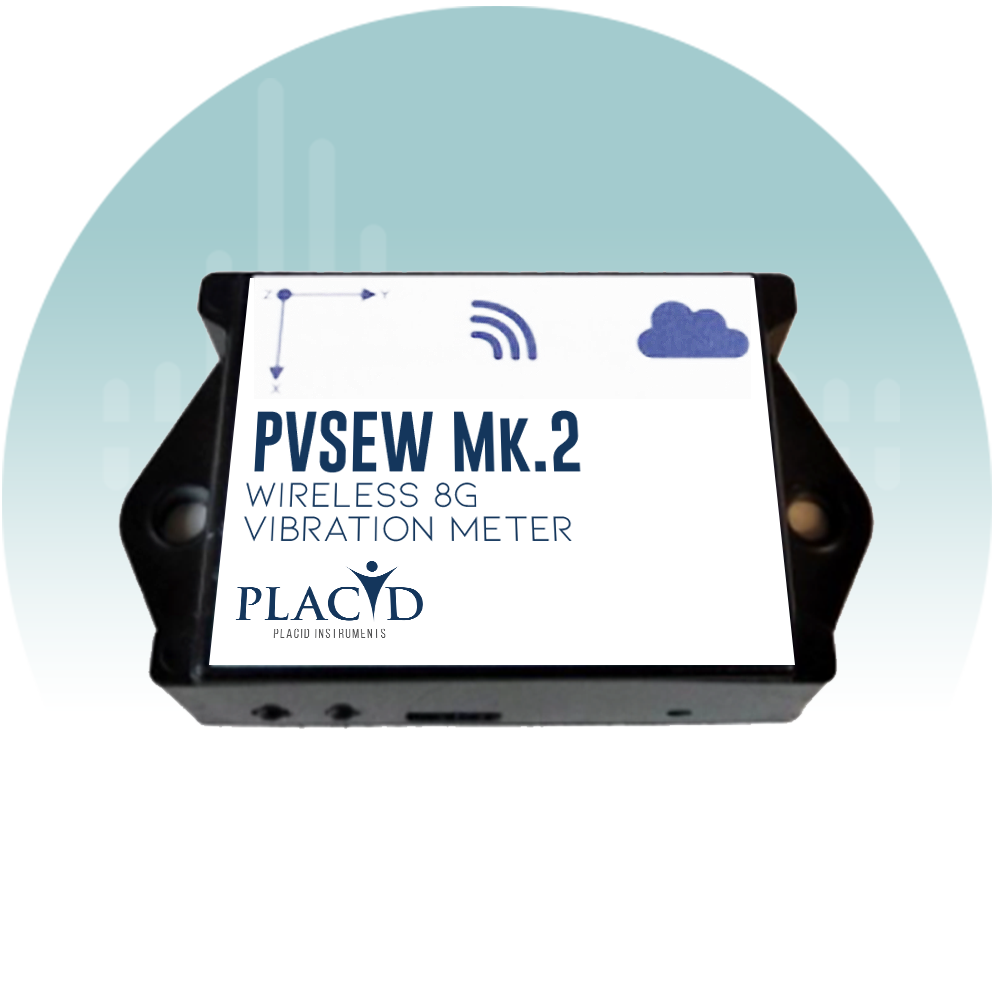
Triaxial vibration logger, wireless, MEMS based DIN4150, PVSEW
The Wireless Vibration Meter Data Logger – PVSEW_mk2 – 8g is a new model in the VSE series of smart vibration dataloggers.
It can record accelerations, vibrations, velocities, and inclinations. It includes a 3-axis MEMS accelerometer, an accurate date/time clock and a non-volatile 128 Mb recording memory. Depending on the settings it can record acceleration or velocity signals and/or RMS levels for months. Its small size allows it to be attached to, or embedded within, the monitored equipment.
The Data Collection Service
- 24/7 data collection from instruments anywhere in the world
- No need for a dedicated server for data collection or emails
- Automatic alarm emails with no need to configure email account
- Automatic instrument configuration through the web
- Data can be downloaded via simple web browser from anywhere in the world
- Data can be viewed at any time on any web browser, such as PC, MAC, phone… etc.
- 500 MB of storage space per instrument
FEATURES
- Can measure, record and trigger on velocity signals, in addition to acceleration
- Has WiFi reporting and email
- Includes an accelerometer with exceptional noise floor (20 times better noise floor than the Vibration Sentry E -16g).
- Sampling rates up to 4
- Improved anti-aliasing
- 3-Axis integral MEMS accelerometer
- Measures and records:
- Raw acceleration or velocity signals
- Acceleration or velocity statistics
- Vibration or velocity levels
- Inclinations
- All-digital
- Integrated oscilloscope function that can show the vibration or velocity signals in real tim
- Allows the observation of recorded data while the recording is
- Works standalone, or USB or WiFi connected for setup and data transfer to
- Long life internal rechargeable battery that recharges from US
- Self-calibrated using the earth’s gravity as a
- Observes and records 100% of the acceleration signals (no missed samples).
- Editable individual custom ID for easier instrument management.
- Completely sealed weatherproof
APPLICATIONS
- Building-health monitoring on construction sit
- Long-term seismic monitorin
- Long-term inclination monitorin
- Long-term measurement and recording of acceleration signals, velocity signals, signal statistics (peaks and average) and RMS
- Continuous monitoring of machinery wear.
DATASHEET PLACID PVSEW Mk.2
Number of Axes | 3 |
Acceleration Sensor | MEMS 3-axes |
Dynamic Range (-8g) | +/- 8g |
Bandwidth High Limit |
• Adjustable, up to 2 kHz (@4 kHz Sampling Rate) |
Bandwidth Low Limit |
• DC (High-Pass Filter Bypass)
• Adjustable from 10 mHz to Fs/2 (High-Pass Filter On) |
Acceleration Noise X-Y Axes (Typical) |
Note: Acceleration noise is primarily affected by the sampling rate. The higher the sampling rate, the higher the noise.
• -82 dBg (80 μg RMS) @ 125 Hz Sampling Rate • -66 dBg (500 μg RMS) @ 4 kHz Sampling Rate |
Acceleration Noise Z Axis (Typical) |
Note: Acceleration noise is primarily affected by the sampling rate. The higher the sampling rate, the higher the noise.
• -80 dBg (100 μg RMS) @ 125 Hz Sampling Rate • -64 dBg (600 μg RMS) @ 4 kHz Sampling Rate |
Velocity Noise X-Y Axes (Typical) |
Note: Velocity noise is primarily affected by the high-pass cutoff frequency. The lower the cutoff frequency, the higher the noise.
• -94 dB-m/s (20 μm/s RMS) @ 1 Hz High-Pass Cutoff • -103 dB-m/s (7 μm/s RMS) @ 10 Hz High-Pass Cutoff |
Velocity Noise Z Axis (Typical) |
Note: Velocity noise is primarily affected by the high-pass cutoff frequency. The lower the cutoff frequency, the higher the noise.
• -92 dB-m/s (25 μm/s RMS) @ 1 Hz High-Pass Cutoff • -101 dB-m/s (9 μm/s RMS) @ 10 Hz High-Pass Cutoff |
Inclination Angle Noise |
Note: Measured using acceleration average, with a log interval of 1s, with the instrument positioned with the Z axis vertical, and X and Y axes horizontal
• 1 𝐸𝐸−3° |
Inclination Angle Temperature Stability | Note: Measuredusing acceleration average, with a log interval of 1s, with the instrument positioned with the Z axis vertical, and X and Y axes horizontal.
• 0.2° over the temperature range -20 °C to 60 °C |
Real-Time Spectral Display | 2048-point Power Spectrum – dB or LinScale. |
Calibration | Self-Calibration using the earth’s gravity as a reference |
Connectivity | • USB • WIFI |
Measurements |
• Raw Acceleration (g or m/s2)
• Raw Velocity (m/s) • Min, Max and Avg Acceleration values (g or m/s2) • Min, Max and Avg Velocity values (m/s) • Inclinations • Min, Max and Avg RMS Vibration level (linear or dB, g or m/s2) • Min, Max and Avg RMS Velocity level (linear or dB, m/s) |
Alarm email |
• Acceleration Signal Threshold (X, Y, Z axis)
• Velocity Signal Threshold (X, Y, Z axis) • RMS Acceleration Level Threshold (X, Y, Z axis) • RMS Velocity Level Threshold (X, Y, Z axis) • Battery |
Duty Rate of Signal Capture | • 100% – No Missed Samples |
Spectral Display | • 3-Axes 1024-point Power Spectrum – dB or Lin Scale. |
Modes of Operations |
• Idle (Micro-Power)
• USB-Connected (Active) • Recording (Stand-alone) • Auto-Rec (Stand-Alone) o Idle when no activity o Recording while activity is present |
Battery Type | Integral Li-Poly – USB-Rechargeable |
Recharge Time | 2 H 30 (Typical) |
Battery Autonomy (Full- Charge) | • Up to one year while in Idle
• 16 days to 125 days while recording, depending on settings |
Battery Life | > 300 Charge/Discharge Cycles |
Temperature Range | -20 deg C to 60 deg C (-4 deg F to 140 deg F) |
Recording Memory | Non-Volatile Flash Memory |
Recording Memory Capacity |
• 128 Mb
• Ex: can continuously record single-axis raw signals for 17 min @ 4 kHz Sampling Rate • Ex: can continuously record 3-axes full-statistics levels at 1s intervals for 5 days • Ex: can continuously record 3-axes full statistics levels a 1min intervals for 10 months. |
Recording / Erasure Cycles | Greater than 100 000 |
Data Retention | Greater than 20 Years |
Dimensions | • 76.2 mm x 39.4 mm x 20.6 mm
• (3” x 1.55” x 0.81”) |
Weights | 65 g |
Construction | Integrally Potted Weather-Proof ABS Enclosure |
FREQUENCY RESPONSE
UPPER FREQUENCY LIMIT
Figure 1 shows the response of the accelerometer structure and its acquisition chain, along the X and Y axes, at 4 kHz sampling rate
Figure 1. X and Y Axes
Figure 2 shows the response of the accelerometer structure and its acquisition chain, along the Z axis, at 4 kHz sampling rate.
Figure 2. Z Axes
LOW FREQUENCY LIMIT
The low-frequency can optionally be limited by the digital high-pass filter. The cutoff frequency is adjustable and can be adjusted to extremely low frequencies thanks to the filter’s exceptionally high resolution. Figure 3 shows the low- frequency response for a high-pass filter adjusted to 1 Hz, 5 Hz and 10 Hz, and operating at 4 kHz sampling frequency.
Figure 3. High Pass Filter
Noise
ACCELERATION NOISE
Figure 4 shows the RMS noise along the three axes, as a function of sampling frequency.
Figure 4.
Noise
ACCELERATION NOISE
Figure 5 shows the acceleration noise spectrum when the accelerometer is sampling at 4 kHz.
Figure 5.
Noise
ACCELERATION NOISE
Figure 6 shows the RMS velocity noise as a function of the cutoff frequency of the high-pass filter. The velocity noise is not significantly influenced by sampling frequency.
Figure 6.
Consult the Data Collection Tab on this page for more info on our 24/7 Data Collection Service.